Monitoring
What the admin UI watches on your server, and where it shows it: the Health table, Needs attention, the checks of your public URLs and your settings, the Configuration page, the Activity page with its event log, and the Prometheus metrics. Alerts on all of this are in Alerts.
Health
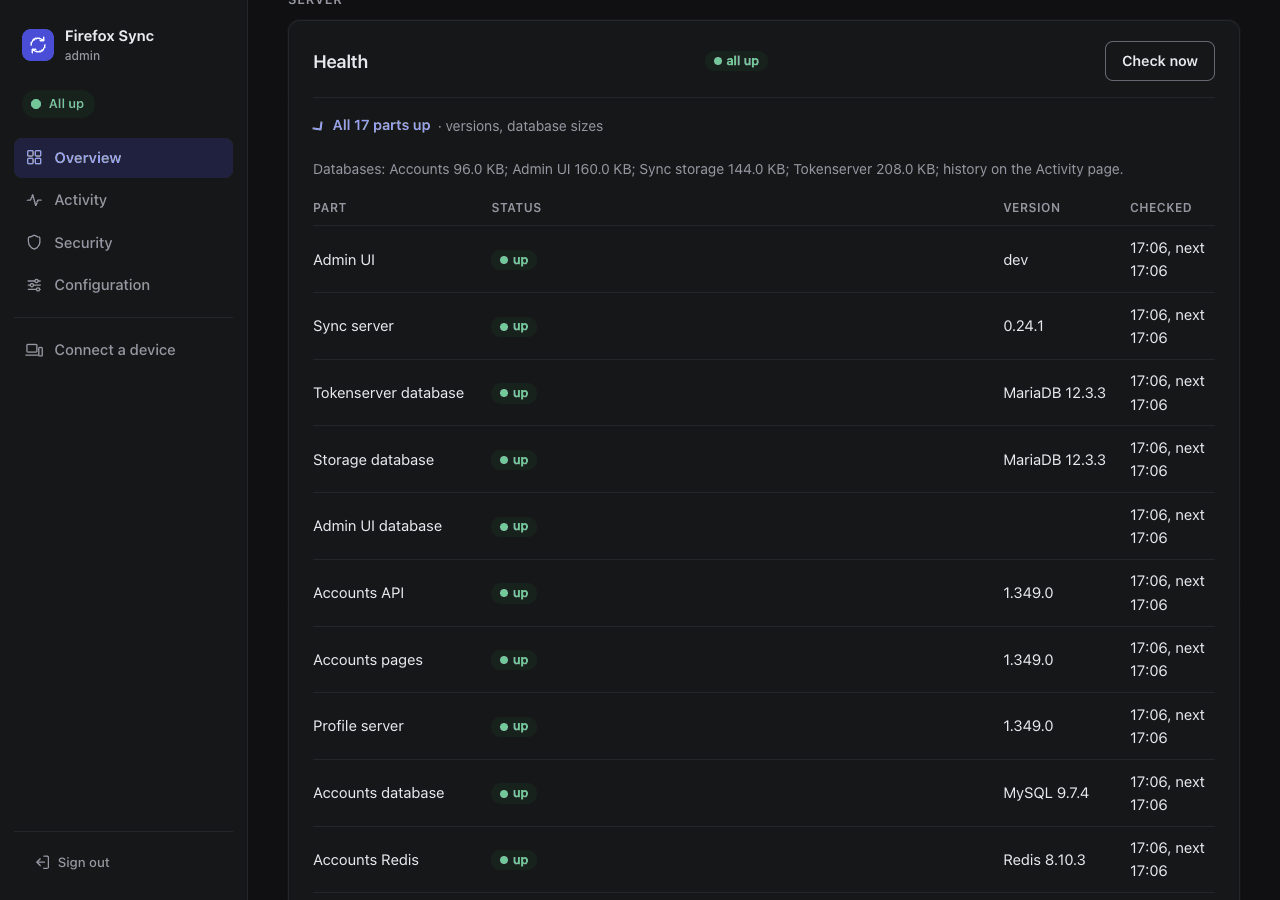
The Health part of the overview shows, for each component, whether it answers its health check: the Sync server, the databases and, with self-hosted accounts, the accounts services. It also shows:
- the versions running, and whether a newer release is out, see Versions and schema levels, with the schema levels and the setup migrations of the databases;
- the limits: the accounts against max users and max accounts, see Limits;
- the Email (SMTP) row and the Notifications row, see Alerts;
- the public URLs with their certificates, see Public checks;
- rows that appear only when they have something to say:
Sync metrics,Sync error rate,Database growth.
A health light on every page ("All up", "1 part to check", "2 parts down") links to the Health part of the overview. The checks run every minute, a "round of checks".
The summary at the top
Under Needs attention, the tiles (Health, Using Sync, Accounts, Sync data, Backups) and a row of badges for who may come in when that is restricted on purpose. The badges are yellow: a notice, not a problem. A limit near or at its maximum keeps the amber of the tiles, and a part down its red. Each badge links to the card where it is changed and says where it is set: set here (in the admin UI), or the setting of .env (the value of the chart) that fixes it, the whole sentence on hover.
| Badge | When | Where it is changed |
|---|---|---|
Sign-ups closed, Sign-ups: allowlist only (N emails or domains) |
self-hosted accounts, the sign-up policy not open | the Sign-ups card, see Sign-ups; FXA_SIGNUPS replaces it when it changes in .env |
Max accounts N/M, No new accounts (max accounts 0) |
self-hosted accounts with a limit | the Max accounts form with FXA_MAX_ACCOUNTS=initial:N, else .env, see Limits |
Invite-only Sync (N pending) |
SYNC_ALLOWED_ACCOUNTS on |
the Invite-only Sync card with SYNC_ALLOWED_ACCOUNTS=admin, else .env, see Invite-only Sync |
Max users N/M, No new Sync accounts (max users 0) |
a limit on Sync | the Sync card with SYNC_MAX_USERS=initial:N, else .env, see Limits |
Open sign-ups and no limits: no badges.
When it was checked
Each row of the Health table, and each setup check, says when it was checked and when it is checked next, in the admin UI's time zone: 18:25, next 18:30. The checks of a round are due a minute later, the public checks an hour later, or sooner while they fail. Most setup checks are read at every load of the overview: 18:25, again at every load.
Check now, in the Health and Setup checks cards, runs every health check and setup check at once, without waiting for their next time, then shows the overview again. It is a form with the session's token, like the other buttons (see Confirm pages), and runs at most every 30 seconds, whoever asks: a click sooner says when it can run again. It changes nothing, so it is not in the audit trail. When the checks take longer than 45 seconds (a public name that does not answer), the overview comes back first and the results show up a moment later.
Startup grace
The admin UI starts with the stack, often before the parts it checks: after docker compose up -d of the whole stack, or on Kubernetes, where the pods start in any order (the chart's admin UI waits only for the Sync server and the accounts API). A part that does not answer is then in one of these states:
| State | When | Counted, alerted |
|---|---|---|
starting |
its container is starting: the runtime says so (its pod not Ready yet, nothing restarted). Shown with since when: since 18:25, 40 s |
no, for at most 10 minutes since its pod started |
waiting |
nothing says whether it is starting, and it has not answered since the admin UI started, in the first 10 minutes. Or a check that goes through a part starting or waiting: waiting for Sync server |
no, until 10 minutes after the admin UI started |
down |
everything else: it answered once and fails now, the runtime says it crashed, or it is still not up after those 10 minutes | yes, an event and an alert |
A crash is down at once, never starting: a container that restarted, exited with an error, or waits in CrashLoopBackOff, Error, OOMKilled, ImagePullBackOff and the like (also an init container), with what the runtime says: Profile server is down: connection refused; fxa-profile-5d9 (profile): CrashLoopBackOff, 4 restarts, last exit code 1 (Error). A pod Ready whose check fails is down too.
What the admin UI can see of the containers (the Configuration page says it, State of the containers):
- Kubernetes with
admin.podStatus: true: the pods of the release, read through the Kubernetes API with a Role that may only get and list pods in the release's namespace. Its token is mounted in the admin UI's container alone. Off by default: the chart's pods do not use the Kubernetes API otherwise. - Kubernetes without it, docker compose, the Quadlets: nothing. The Docker or Podman socket would give the admin UI the host (or your account), so it never gets it. A part that has not answered yet is
waiting, and its row says why the precise state is not known and when it turns down:no answer yet since the admin UI started, and the admin UI does not see the Docker containers (...) (connection refused): down if still so at 18:35. A part that crashes after it answered once is down at once, as always.
Which checks go through which part: the public Sync URL through the Sync server; the public accounts pages, accounts API and profile server through their services; the sign-up gate and, with self-hosted accounts, the sign-in keys of FXA_OAUTH_SERVER_URL through the accounts API. They wait while that part is starting or waiting, and run in the same round once it is up. A part down takes them down with it.
While something is starting or waiting, a round runs every 10 seconds, not every minute. A part that comes up from either raises no is back up: its down was never announced. The health light says "Starting", the Health tile "15 of 16 parts working, 1 starting"; Needs attention lists neither.
Whenever a part comes back up (after the start too), the checks that go through it run again at once, and so does any failing public check. While they fail after the start or after such a return, they run again after 30 seconds, then 1, 2 and 5 minutes, then at their usual retry (every 5 rounds): the public URL behind a reverse proxy that is still starting does not stay down for 5 minutes.
Needs attention
The top of the overview lists what to look at now, one line each, with a link to where it is fixed. A line is amber, or red when a component is down. With nothing to list it says "Everything is working", in green.
| Line | Link |
|---|---|
a component down (the Health table), or the sign-in keys of FXA_OAUTH_SERVER_URL |
Health, Setup |
| a newer release of a component | Health |
| a certificate of a public URL expiring in less than 14 days | Health |
| sign-ups that bypass the sign-up gate, see Public checks | Health |
| the SMTP server does not work, or the last alert email failed | Health, the alert status |
| max users near or at the limit, see Near and full | the max users form |
| accounts refused by invite-only Sync, waiting for your approval | Pending accounts |
| self-hosted accounts: max accounts near or at the limit | the max accounts form |
| a backup failed, or the last good one is older than 36 hours | Backups |
| orphaned Sync data, see Storage | the purge |
| Sync data changed without metrics from the Sync server: it needs a restart, see Sync metrics | Activity |
| a spike of Sync errors, or a database growing fast, see Errors and growth | Activity |
| self-hosted accounts: accounts blocked by the rate limits | Security |
| accounts that never confirmed their email | the list of those accounts (one account: its page) |
| accounts with a sign-in that never entered its email code (someone may have the password), counted until it is confirmed or signed out | the list of those accounts (one account: its sessions, with Confirm this sign-in… and Sign out…) |
devices not used for ADMIN_STALE_DAYS (90) |
the list of those accounts (one account: its devices) |
| the accounts database not pruned for 2 days, see Maintenance and retention | Activity |
the setup migrations of a database server: one this release needs not recorded there, a user or grant they give missing (drift), the last start stopped at db-bootstrap, or a newer version than this release's, see Setup migrations |
Technical details |
The links to a part of the list show only those accounts: /?show=blocked, unconfirmed, unconfirmed-sign-in, inactive, inactive-devices.
Some lines also alert, as events of kind attention: the limits (see Near and full), Sync data changed without metrics, alert emails failing, a spike of errors, a database growing fast. Each alerts once when its state changes, not every minute, and at the start of the admin UI when it is already the case. The other lines have alerts of their own already (components, releases, certificates, blocks, backups).
The limits, the error rate and the growth are also rows of the health table. The health light counts them as "to check" only when they are near or over.
Public checks
Every hour the admin UI looks at your server from the outside, the way Firefox does. It checks each https:// URL: the Sync node the tokenserver hands out and, with self-hosted accounts, FXA_CONTENT_URL, FXA_AUTH_URL and FXA_PROFILE_URL.
- It opens a TLS connection and reads the certificate.
- It asks
/__heartbeat__through your reverse proxy.
The Health table then shows reachable, certificate expires in N days. Under 14 days left, or when the URL does not answer, the row turns to a problem, with an event and an alert. While a check fails it runs again every 5 rounds of checks, so a name the server cannot reach does not hold up the other checks; after the start of the admin UI, or after the part it goes through came back up, sooner: see Startup grace. A Sync node the tokenserver no longer hands out (downed or removed) leaves the metrics.
With self-hosted accounts it also checks that POST /v1/account/create of FXA_AUTH_URL reaches the sign-up gate (see Who can sign up). It sends a request with an empty body and a header carrying a random token of this start of the admin UI:
- The gate answers it itself (204, with the token) and passes nothing on.
- A reverse proxy that sends sign-ups to the accounts service directly passes the empty body on, and the accounts service refuses it: the row says the gate is bypassed.
- The probe never creates an account, whatever the sign-up policy.
"not reachable from the server" means the server could not connect to its own public name. Often that is split DNS (the name resolves to another address inside your network) or a firewall, or the server cannot reach its own public address (hairpin NAT). Firefox may well reach it from outside. If you want the check, add the name to the server's /etc/hosts or your local DNS.
http:// URLs and unset ones are not checked. ADMIN_PUBLIC_CHECK=false (or 0) turns all of them off, and with them the check of FXA_OAUTH_SERVER_URL when it is on the internet (Mozilla's accounts).
Setup checks
The overview lists settings that must agree with each other, each with what goes wrong when they do not:
- Event log (
ADMIN_DB_PASSWORD): where the event log, the audit trail and the notes are. WithoutADMIN_DB_PASSWORD(an install from before it) they are in the tokenserver database, which the Sync server's database user can read and change: the check says how to move them, see The admin UI's own database. It also warns when the admin UI's database holds something its user does not own (the admin UI does not start again until it is dropped), when admin UI tables of before are still, or again, in the tokenserver database, and on PostgreSQL when the Sync tables belong to a superuser, which can still read the event log. - Database users and grants (
database-setup.sql), with your own database server (SYNC_DB_CONTAINERS=0): the grants of the admin UI's own two users. On MariaDB and MySQL, those of theirGRANTlines:ADMIN_DB_USERonADMIN_DB_NAME,ADMIN_DB_SYNC_USERon the tokenserver and storage databases. On PostgreSQL, thatADMIN_DB_NAMEbelongs toADMIN_DB_USER, and that neither it nor the tokenserver database lets every role connect. What is missing is named with the statement that gives it, see When a release needs new users or grants. - Sync node: the tokenserver hands out the Sync node of its
nodestable, which the init container sets fromSYNC_PUBLIC_URLwhen it starts. When they differ (.envchanged, the stack not restarted), the warning names both: Firefox syncs with the one of the table. - Sign-in keys (
FXA_OAUTH_SERVER_URL): the Sync server checks every sign-in of Firefox with the keys atFXA_OAUTH_SERVER_URL/jwks(/v1added when missing). Checked every hour; with self-hosted accounts after the accounts API (see Startup grace): right after a start it says it waits for it, not that nobody gets a Sync token. With Mozilla's accounts that is Mozilla's server, so it is checked only with the public checks on. With self-hosted accounts it ishttp://fxa-auth:9000/v1: pointing atfxa-authon another port (the host port ofFXA_AUTH_EXPORT_PORTcopied over,fxa-auth:9010), it fails and saysFXA_OAUTH_SERVER_URL is container-to-container: inside the stack the accounts API is always fxa-auth:9000; FXA_AUTH_EXPORT_PORT is the host port for your reverse proxy, also on the Settings page (Sign-in keys: connection refused). Once the keys answer it also says whose accounts that lets in: with self-hosted accounts only those of this accounts server, Mozilla's are refused; with Mozilla's accounts only Mozilla's (Only your own accounts). - Telemetry of the accounts pages, with self-hosted accounts: the settings the accounts web pages run with, read from the page config the content server writes into them (the
fxa-configmeta tag of its/settingspage, inside the stack). It warns when Glean, its upload, Sentry or Nimbus is on, or the Glean endpoint is not the accounts pages themselves (FXA_CONTENT_URL; empty is Mozilla's), naming the setting and where the data would go: after an upgrade that changed one of Mozilla's defaults, or ano-telemetry.envthat is not read any more. It warns too when the page config is not found, so that nothing can be said. Checked every hour, after the accounts pages are up. See Telemetry. - Email of the accounts (
FXA_SMTP_HOST), with self-hosted accounts: without an SMTP server nobody can sign up or sign in, see Do you need an SMTP server?. Without self-hosted accounts there is no such check. - Sync node load: the tokenserver counts a refused new account in its node's load (see
SYNC_ALLOWED_ACCOUNTS): the admin UI counts it again from the node's accounts every few minutes, at once when it is off by 10 or more. That last case is a warning for a day, with the counts: many refused tries in a short time. - Pending accounts list, with invite-only Sync: accounts refused without a record because its list of 1000 was full, for a week after the last one.
- Old setting names, with docker compose: settings of
.env, or of the environment compose runs in, still under their names from before theSYNC_prefix. They still work, and a later release removes them../prepare_environment.sh --upgraderenames them, see Renamed settings. The Quadlets and the chart have the new names only. - Account emails (
FXA_EMAIL_DOMAIN): the tokenserver keeps each account as<uid>@FXA_EMAIL_DOMAIN. AfterFXA_EMAIL_DOMAINchanged, everybody comes back as a new account, with empty storage, and counts twice against max users. The warning names the domain set and the others found, with how many accounts each.
The Sync nodes table, in the Sync section, shows for each node the accounts on it (those whose current keys are there), its capacity, current load, places available and backoff.
Configuration page
The Configuration page (/config, in the menu) shows the settings the admin UI runs with, read-only, so you can check them without opening .env. They are grouped by part: public URLs, Sync and its databases, the accounts, the limits, signing in, email, alerts, backups, maintenance, metrics.
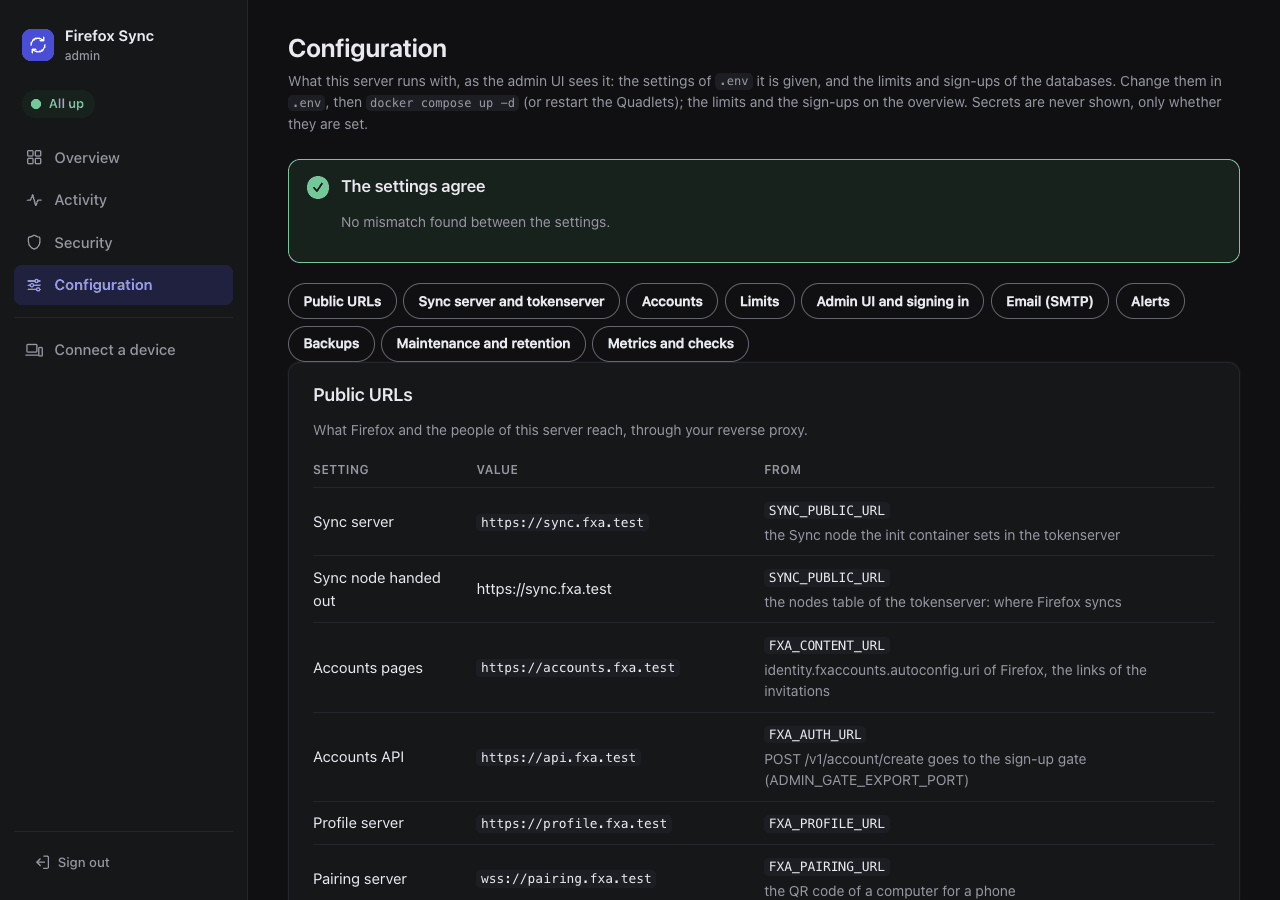
Each setting shows its value, the variable it comes from (or (default) when it is not set), and what it does:
- Database servers: with the version the health checks read from them. On your own server, only MySQL or MariaDB until the first check.
- Switches are read as the admin UI reads them:
ADMIN_INSECURE_COOKIEandADMIN_SMTP_INSECURE_AUTHwith1,trueoryes(another value than those and0,false,nostops the admin UI at its start),ADMIN_UPDATE_CHECK=falseandFXA_SMTP_SECURE=trueexactly. - The Sync databases: with the user the admin UI connects as,
ADMIN_DB_SYNC_USER, next to its own database (ADMIN_DB_USER,ADMIN_DB_NAME). An install from beforeADMIN_DB_PASSWORDshows the Sync server's users, and the event log in the tokenserver database. - Thresholds of Errors and growth and the security history, as in force.
- The limits and the sign-up policy: what is in force in the database, and where it comes from.
SYNC_MAX_USERS=initial:5says the overview manages it (and what it is now),SYNC_MAX_USERS=5that the init container sets it on every start.
To change a setting, edit .env and start the stack again, or with the Helm chart your values and helm upgrade. On Kubernetes the page names the values as the variables of .env. The limits and the sign-ups are changed on the overview.
Secrets are never on the page, only "set" or "not set": ADMIN_PASSWORD, ADMIN_OIDC_CLIENT_SECRET, ADMIN_METRICS_TOKEN, FXA_SMTP_PASS and the passwords of the databases. A password inside a URL is hidden too, and the destinations of ADMIN_NOTIFY show as scheme://host only. The admin UI does not get the other secrets of .env at all (SYNC_MASTER_SECRET, the keys of the accounts service).
Why no secret can end up there
Every variable the admin UI reads, or is given by compose and the Quadlets, is listed in the program as a secret or not. A unit test fails on a new one that is not, so a future setting cannot reach the page by default.
For this page the admin UI also gets a few settings it does not use itself, none of them secret: SYNC_DB, ADMIN_EXPORT_PORT and, with the accounts, FXA_DB, ADMIN_GATE_EXPORT_PORT, FXA_CLIENT_ADDRESS_DEPTH and FXA_ACCESS_TOKEN_LIFETIME.
Settings that disagree
On top, the page lists the settings that disagree, found without asking anything outside:
- the setup checks that fail;
- a public URL that is not
https://(SYNC_PUBLIC_URL,FXA_CONTENT_URL,FXA_AUTH_URL,FXA_PROFILE_URL;http://localhostis fine), or a pairing server that is notwss://; - two public URLs on the same host name: each needs its own, see Host names and ports;
- with self-hosted accounts,
FXA_EMAIL_DOMAINother than the host ofFXA_AUTH_URL, orFXA_OAUTH_SERVER_URLpointing to other accounts than these (Mozilla's); - the trusted header with
ADMIN_EXPORT_PORTon an address other than loopback; ADMIN_OIDC_TRUST_UNVERIFIED_EMAIL=truewith another provider than the self-hosted accounts;ADMIN_INSECURE_COOKIE;ADMIN_ALERT_EMAILwithout an SMTP server (withADMIN_NOTIFYset, the alerts go there only);- a token sent over plain HTTP to a destination outside your network, see Destinations;
- backups failing, too old, or not recorded at all (off).
Versions and schema levels
Every 12 hours the admin UI asks GitHub for the newest releases of syncstorage-rs and of Mozilla accounts, and shows when the running version is older. The images of this project follow the upstream releases within a week, see Images. ADMIN_UPDATE_CHECK=false turns the check off.
With ADMIN_PUBLIC_CHECK=false too, the admin UI never connects to the internet, other than to your own public URLs, and your SMTP server and single sign-on provider when they are set.
Next to the versions, the overview shows the schema of each database:
- the newest migration syncstorage-rs ran on the tokenserver and storage databases, with when it ran;
- the
schema-patch-levelof each accounts database (fxa,fxa_oauth,fxa_profile,pushbox). FxA records no time for it, so the Applied column says "not recorded by FxA".
A change is recorded as an event (kind update) and alerted, once: an upgrade that migrated, or a database restored from an older backup. The levels seen last are kept in the admin UI's database (ffs_schema_levels), so an upgrade of the whole stack, the admin UI with it, is noticed too.
Setup migrations
Below the schema levels, under Technical details, "Setup of the database servers" has a row per scope: Sync, and the accounts when they are self-hosted. It shows the setup migrations that the database server recorded against those of this release: "version 001 (applied baseline on ...), this release expects 001", and whether they are in order. How they were applied: bootstrap (db-bootstrap with its bootstrap account), manual (by hand), baseline (an install from before them) or containers (the stack's own database containers).
The admin UI reads the record in ffs_setup_migrations every round of checks, and the result of the last start of db-bootstrap in ffs_setup_state. With your own server it also checks its own users' grants, from SHOW GRANTS (their roles too): a grant revoked by hand shows as drift without waiting for a restart. The users it cannot see (the Sync server's) are checked by db-bootstrap at every start.
A line in Needs attention, an event (kind attention) and an alert, once when it starts and once when it is in order again, when:
- a file this release needs is not recorded on the server (
db-bootstrapapplies it at the next start with the bootstrap account, otherwise run it, see When a release needs new users or grants); - a user or grant of the files is missing (drift), seen by the admin UI or by the last start (then said "as of the last start", until a later start finds it all; what only the admin UI's own users lack, it checks again itself every round);
- the first start of this release stopped at
db-bootstrap(nothing recorded yet, its result kept); - the last start stopped at
db-bootstrapfor another reason; - the server has a newer version than this release expects (an older release on a newer setup).
An install whose server has no record yet (its first start of this release not done) shows "not recorded", without an alert.
Sync metrics
The Sync server (syncstorage-rs and its tokenserver) sends its statsd metrics to the admin UI over UDP, port 8125. They feed the Activity page and Errors and growth.
| Install | Where the metrics go |
|---|---|
| docker compose, Quadlets | inside the stack's network only |
| Helm | the admin UI's Service, which every pod of the cluster reaches unless a NetworkPolicy of yours says otherwise (the chart has none for it) |
The admin UI must be running when the Sync server starts. syncstorage-rs refuses to start when its metrics host does not resolve, so it sends metrics only when the admin UI was up at its start. It also looks up the admin UI's address only then.
| Install | What that means |
|---|---|
| docker compose, Quadlets | they start the admin UI first when it is enabled; the Sync server starts as before without it. A new admin UI container (an update, docker compose up -d after a change) restarts the Sync server |
| Helm | the Sync server sends to the admin UI's Service, whose address stays when the pod is replaced. Turning the admin UI on or off starts a new Sync server pod |
If the Activity page says no metrics arrive, restart the Sync server.
An idle server sends little: syncstorage-rs sends metrics only while it serves requests (since 0.24 the health checks count, see Errors and growth), and holds them until a datagram is full. So the metrics count as missing only when Sync data changed more than 10 minutes after the last metrics arrived (or after the start of the admin UI or the Sync server, when none came since).
The admin UI reads the latest write of the storage database every round of checks for this. When the metrics are missing, the health table shows a Sync metrics row to check. Without a storage database to read, it never does.
Event log
The Activity page shows, over the last 24 hours, 7 or 30 days, the Sync requests, the Sync tokens issued, the errors and the size of the databases. Below them is the event log, each event with its kind:
| Kind | Events |
|---|---|
admin |
sign-ins to the admin UI, and every change made in it, with who made it (below) |
sign-in |
refused sign-ins to the admin UI: a wrong password, not an admin, an email not verified, see Signing in |
sign-up refused |
a sign-up the sign-up gate refused, or the first try of an account that invite-only Sync refused |
health |
a row of the Health table going down, to check, or back up: a component, a public URL or its certificate, the Email (SMTP) row, the Notifications row |
update |
a newer release of a component, a change of the schema levels, the admin UI's tables moved into its own database |
blocked |
self-hosted accounts: an account blocked by the rate limits, see Helping account owners |
maintenance |
the daily jobs and what they did, see Maintenance and retention, and the second pass of a deletion on the Sync storage |
sign-up burst |
self-hosted accounts: more accounts created in an hour than ADMIN_SIGNUP_BURST |
backup |
a backup failed or too old, and working again, see Backups |
attention |
a line of Needs attention that starts or ends: the limits, Sync metrics missing, alert emails failing, a spike of errors, a database growing fast, the setup migrations |
security |
self-hosted accounts: an event of the security history |
sign-up, new device |
self-hosted accounts: a new account, a new device. They are read from the accounts database, not written to the event log |
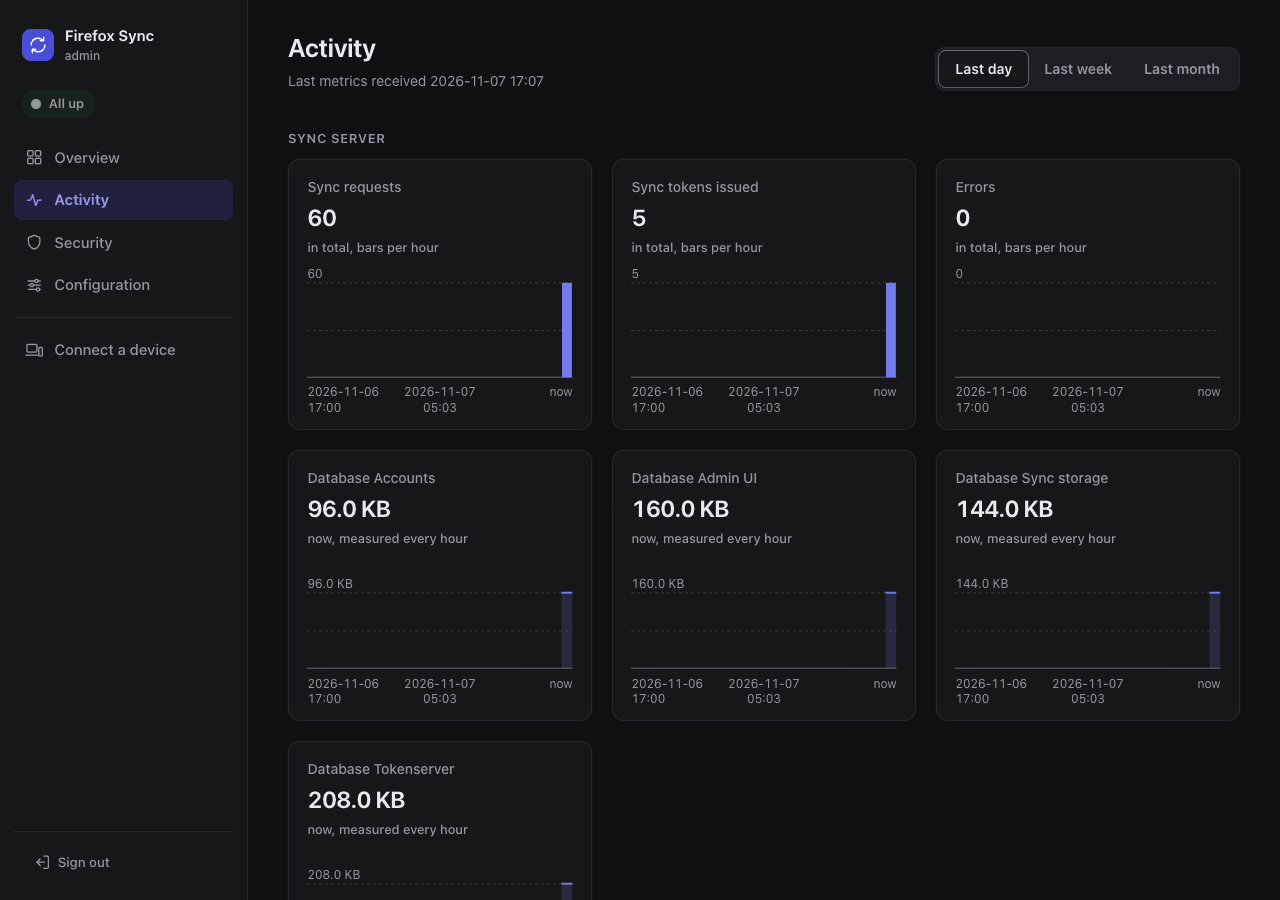
The page filters the log by kind and by text, without case: /activity?kind=admin&q=alice@example.com. It can hide the routine admin sign-ins, and shows 100 events a page with a link to the older ones. The account page links to the events of its email.
Every change made in the admin UI is recorded with who made it and how they signed in, and for an account its email and the start of its id:
Disabled alice@example.com (uid 3f2a1b2c) by bob@example.org (oidc): lost laptop
Max users set to 5 by admin (password)
admin (password) is whoever has ADMIN_PASSWORD. With single sign-on or the header it is their email. The text after the colon is the reason typed on the confirm page, if any.
The metrics are kept per minute and the events as they are, in the admin UI's own database (ffs_metrics, ffs_events), see The admin UI's own database. How long is in Maintenance and retention. At most 30 entries a minute are recorded for each kind of event, except admin: every change is kept. A change is recorded before its result is shown: when that fails (the database out of reach), the result says it is not in the event log, and the admin UI's log has the entry.
Remove personal data from the log
The event log holds personal data: the emails of accounts and of refused sign-ups, the emails of the admins, the reasons typed. When an account is deleted, the events naming it stay until their retention runs out: they are not rewritten. The deletion event itself keeps the email, on purpose, for the audit trail.
To remove them sooner, delete them in the admin UI's database as its user:
-
Open a client on the admin UI's database.
MariaDB (use
mysqlinstead ofmariadbwithSYNC_DB=mysql):docker compose exec tokenserver_db sh -c 'MYSQL_PWD="$ADMIN_DB_PASSWORD" mariadb -u"$ADMIN_DB_USER" "$ADMIN_DB_NAME"'PostgreSQL:
docker compose exec postgres_db psql -U ffs_admin_ui ffs_admin -
Delete the events that name the email:
DELETE FROM ffs_events WHERE detail LIKE '%alice@example.com%';
Errors and growth
The Activity page lists the errors of the Sync server by kind over its range (/activity#errors): the kind, the status Firefox got, the service, how many, the last one, and the statsd metric it comes from.
What syncstorage-rs sends is limited, so this is what you see:
- Client errors of the storage API, one counter each: Hawk authentication (401: no or a wrong Hawk header, an expired Sync token), invalid requests (400: an item that is no JSON object, one too large, a bad batch), a wrong content type (415), conflicts (503) and quota (403).
- Tokens refused: the tokenserver sends no errors, so the admin UI counts the token requests verified without a token issued. That covers a bad or old sign-in, older keys, a client state that does not fit, max users full, and a database error, in one row, since syncstorage-rs does not tell them apart.
- No 5xx of its own: a database that is down shows in the Health table instead. No 404 or 412 either: those are answers (an empty collection, a change from another device).
The Errors chart counts the same. The Sync requests chart counts only the requests of Firefox served, not the errors.
Requests of Firefox, health checks apart. Since 0.24 syncstorage-rs also times every request it answers (syncstorage.request.duration, tagged with its route), the health checks too: /__heartbeat__ of the container's healthcheck (every 30 seconds) and of the admin UI (every round), the public check through your reverse proxy, /__lbheartbeat__, /__version__. On an idle server that is all its traffic. The admin UI counts those of the health checks apart and never as requests: "0 errors of 12 Sync requests from Firefox in the last 15 minutes, alert from 10% and 20 errors; 61 health checks of the Sync server besides, not counted". The requests are the storage API's (one counter per request it served) and the token requests. Before 0.24 there is no timer: the health checks are not counted at all, and are not in the requests either.
Where the errors come from
The metrics, as captured from syncstorage-rs's packets in admin/testdata/statsd-packets.jsonl:
syncstorage.request.error.hawk.*(401),syncstorage.request.validate.*,.process.*and.store.*(400),syncstorage.request.error.invalid_content_type(415),storage.conflict(503) andstorage.quota.at_limit(403). They carry no endpoint or status: the kind is in the name, and the status is the one syncstorage-rs answers for it.- Tokens refused:
syncstorage.token_verificationwithout a matchingsyncstorage.token_creation. The combined server counts only the storage API's errors. - The requests:
syncstorage.request.<handler>(get_collections,post_collection...), one per request a handler of the storage API served, andsyncstorage.token_verification. Notsyncstorage.request.duration, the timer of every request: those withroute/__heartbeat__,/__lbheartbeat__,/__version__or/__error__are the health checks, counted apart. - The Sync server sends its metrics when 512 bytes are buffered, so a token often comes a datagram (and a minute) after its verification. The admin UI pairs them in the order they come, per sender: a verification counts as refused when a datagram of the same Sync server comes 40 seconds after it and its token has not (the token comes after the tokenserver's database work, which waits at most 30 seconds for a connection by default), in the minute of the verification, so a quiet server shows it a little later. The metrics go over UDP: datagrams the network drops make all these counts approximate. Minutes recorded by an admin UI from before this pairing keep the older guess: verified minus issued per minute, the newest minute counted once something newer comes in. A request without any token is not counted.
Two thresholds alert, through the event log (kind attention) and the alerts, once when they start and once when they end. They also show as a row of the health table and a line of Needs attention.
A spike of errors
Every round of checks, the admin UI compares the errors of the last 15 minutes with the requests of Firefox (served, refused and failed; not the health checks). A spike needs all three:
ADMIN_ERROR_RATE_PERCENT(10) percent or more of the requests;- at least
ADMIN_ERROR_RATE_MIN_ERRORS(20) errors, so a small server does not alert on one error in two requests; - 3 times the share of the 24 hours before, so a server that always refuses some old Firefox does not alert all day.
It ends under half of either. The health row Sync error rate shows the last 15 minutes when it is fine. ADMIN_ERROR_RATE_PERCENT=0 turns it off, and removes the row.
A database growing fast
Every hour, after measuring the databases, the admin UI compares the growth of each in the last 24 hours with the sizes kept. It alerts on either rule:
- above
ADMIN_DB_GROWTH_MB(1024) a day; - above
ADMIN_DB_GROWTH_FACTOR(5) times its usual growth: the median of the 7 days before, once there are 3 of them, and only from 100 MB a day.
Nothing is compared before a day of measures, or while the admin UI was off a day ago (no measure within 2 hours). Shrinking is no growth. The health row Database growth shows each database's growth in the last day. 0 turns a rule off, both at 0 the row.
On MySQL (SYNC_DB=mysql, and the accounts on MySQL) a small growth can show an hour or two late. MariaDB and PostgreSQL measure the size of now.
Why MySQL is late
The admin UI reads the sizes past the day-long cache of information_schema (information_schema_stats_expiry = 0 for its session). InnoDB still updates them only when it recomputes the statistics of a table, after about 10% of its rows changed.
Prometheus
With ADMIN_METRICS_TOKEN set, the admin UI serves Prometheus metrics at http://ffs-admin:8080/metrics, on the stack's network or on ADMIN_EXPORT_PORT. Requests must send Authorization: Bearer <token>:
scrape_configs:
  - job_name: firefox-sync
    authorization:
      credentials: <ADMIN_METRICS_TOKEN>
    static_configs:
      - targets: ["ffs-admin:8080"]
| Metric | |
|---|---|
ffs_up{component} |
1 if the component answers its health check, else 0 (also while it is starting) |
ffs_component_state{component,state} |
1, with the state of the component: up, starting, waiting, warn or down, see Startup grace. Alert on state="down" rather than on ffs_up == 0 to leave out a start |
ffs_sync_accounts, ffs_sync_max_users |
accounts using Sync, and the limit (no ffs_sync_max_users with SYNC_MAX_USERS=unlimited) |
ffs_sync_near_max_users, ffs_sync_full |
1 when 90% of max users or more are taken, 1 when all are |
ffs_sync_pending_accounts, ffs_sync_refusals_dropped |
the accounts refused by invite-only Sync and waiting for an approval, and those refused without a record because the list was full (only while it is on) |
ffs_sync_stored_items, ffs_sync_stored_bytes |
what all accounts store |
ffs_accounts, ffs_accounts_max |
accounts of the self-hosted accounts service, and FXA_MAX_ACCOUNTS (none when unlimited) |
ffs_accounts_near_max, ffs_accounts_full |
the same for FXA_MAX_ACCOUNTS |
ffs_database_bytes{database} |
size of each database, measured every hour |
ffs_database_growth_bytes{database}, ffs_database_growth_alert{database} |
the growth of each database in the last 24 hours, and 1 when it grows fast (once a day is measured), see A database growing fast |
ffs_statsd_total{name}, ffs_statsd_ms_total{name} |
the statsd metrics of the Sync server since the admin UI started |
ffs_statsd_silent |
1 when the Sync server is up and Sync data changed more than 10 minutes after its last metrics, see Sync metrics |
ffs_sync_errors_total{service,status,kind} |
the errors of the Sync server by kind since the admin UI started, kind being the metric without syncstorage. (request.error.hawk.missing_header). The tokens refused are not in it (see below) |
ffs_sync_error_ratio, ffs_sync_error_spike |
the share of the Sync requests that failed in the last 15 minutes (0 to 1), and 1 during a spike |
ffs_cert_expiry_seconds{host} |
seconds until the certificate of a public URL expires, see Public checks |
ffs_alert_last_success_timestamp_seconds |
when the last alert email went out (Unix time; 0: none since the start), with ADMIN_ALERT_EMAIL |
ffs_alert_send_failing |
1 when the last alert email could not be sent |
ffs_notify_failures_total{destination} |
the alerts to each destination of ADMIN_NOTIFY that could not be sent, after the retry, see Destinations |
ffs_notify_last_success_timestamp_seconds{destination} |
when the last alert went out to it (0: none since the start) |
ffs_notify_send_failing{destination} |
1 while the last alert to it failed |
ffs_notify_alerts_lost_total{destination} |
the alerts it refused as they were (400, 413, 422): dropped, not sent again |
ffs_notify_test_failures_total{destination} |
the test notifications that failed |
ffs_security_events_total{event} |
the events of the security history since the admin UI started, by Mozilla's name (account.login, account.login.failure, account.password_changed...), with FXA_ACCOUNT_EVENTS=true |
ffs_backup_age_seconds{scope}, ffs_backup_last_ok{scope} |
seconds since the last good backup (sync, accounts), and 1 when the last run worked, see Backups |
ffs_db_setup_version{scope}, ffs_db_setup_expected_version{scope} |
the highest setup migration the database server recorded (sync, fxa; 0: none), and the highest this release ships |
ffs_db_setup_drift{scope} |
1 when a user, grant or database of the setup migrations is missing (the admin UI's check, or the last start's), also while a newer file is pending |
The tokens refused have no counter: verified minus issued goes down when a token comes after its verification, which a counter must not do (rate() would see a reset). Subtract the two counters instead:
increase(ffs_statsd_total{name="syncstorage_token_verification"}[1h]) - ignoring(name) increase(ffs_statsd_total{name="syncstorage_token_creation"}[1h])